Courses/Computer Science/CPSC 203/CPSC 203 Template/Labs Template/Week 1 - Lab 1: Introduction to Spreadsheets and Basic Calculations (revision)
Contents
Introduction
Today's tutorial introduces spreadsheets, using Microsoft Excel 2007 for Windows. After completing this module, you should be confortable in demonstrating the following skills:
- typing in some basic data
- using the AutoFill feature
- setting-up appropriate field formats, such as currency, numbers, text, etc.
- calculating basic statistics
Additional Reading
Lab 5 page 99 of Fluency Computer Skills Workbook
Introduction to Spreadsheets
The spreadsheet software we will be using for this course is Excel 2007 (for Microsoft Windows). There have been many interface changes to Excel 2007 from previous versions of Excel. The following is an outline of some of these changes to help you get started with Excel 2007:
- Ribbon: the introduction of the "ribbon" is the main new interface change to Excel 2007. The ribbon consists of a main toolbar and contextual menus, represented with icons. The ribbon is located above the work area.
- screenshot of ribbon
- Main Toolbar: the main toolbar consists of: home, insert, page layout, formulas, data, review, and view.
- screenshot of main toolbar
- Contextual Menu: each item in the main toolbar has an associated contextual menu. When an item in the main toolbar is selected, the new contextual menu appears with its corresponding icons.
- screenshot of contextual menu
- Office Button: the office button gives access to performing tasks such as opening a file, saving a file, and printing.
- screenshot of office button
- Help: the help icon gives access to help and how-to information.
- screenshot of help
More information regarding Excel 2007 can be found on the Microsoft Office website:
Background material (general introduction, performing basic calculations, advanced calculations, formatting worksheets, making data visible, and manipulating data in Excel 2007) can be found on the following websites:
Type in some basic data
- The following is a step-by-step guide to entering basic data into a spreadsheet in Microsoft Excel 2007 (for Windows).
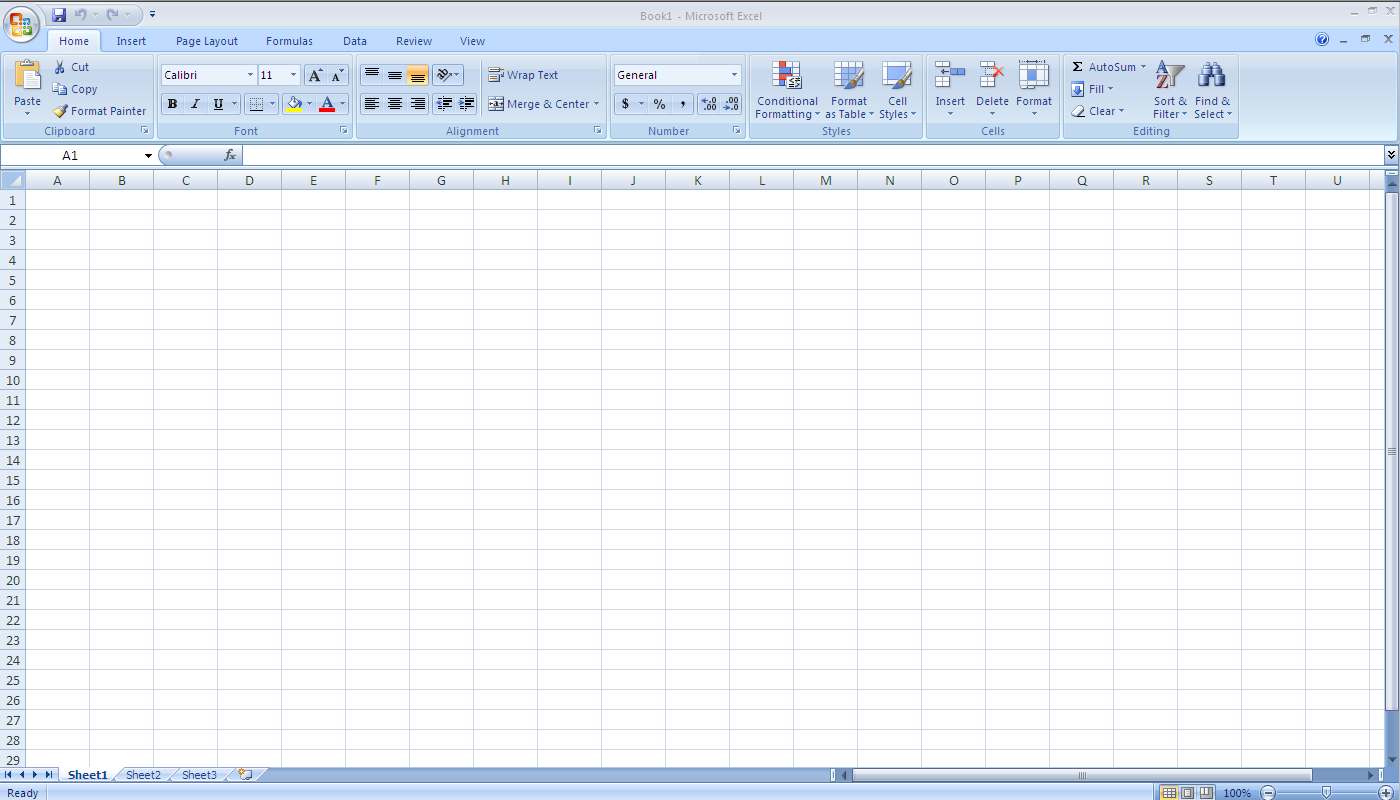
- Step 1: start Excel.
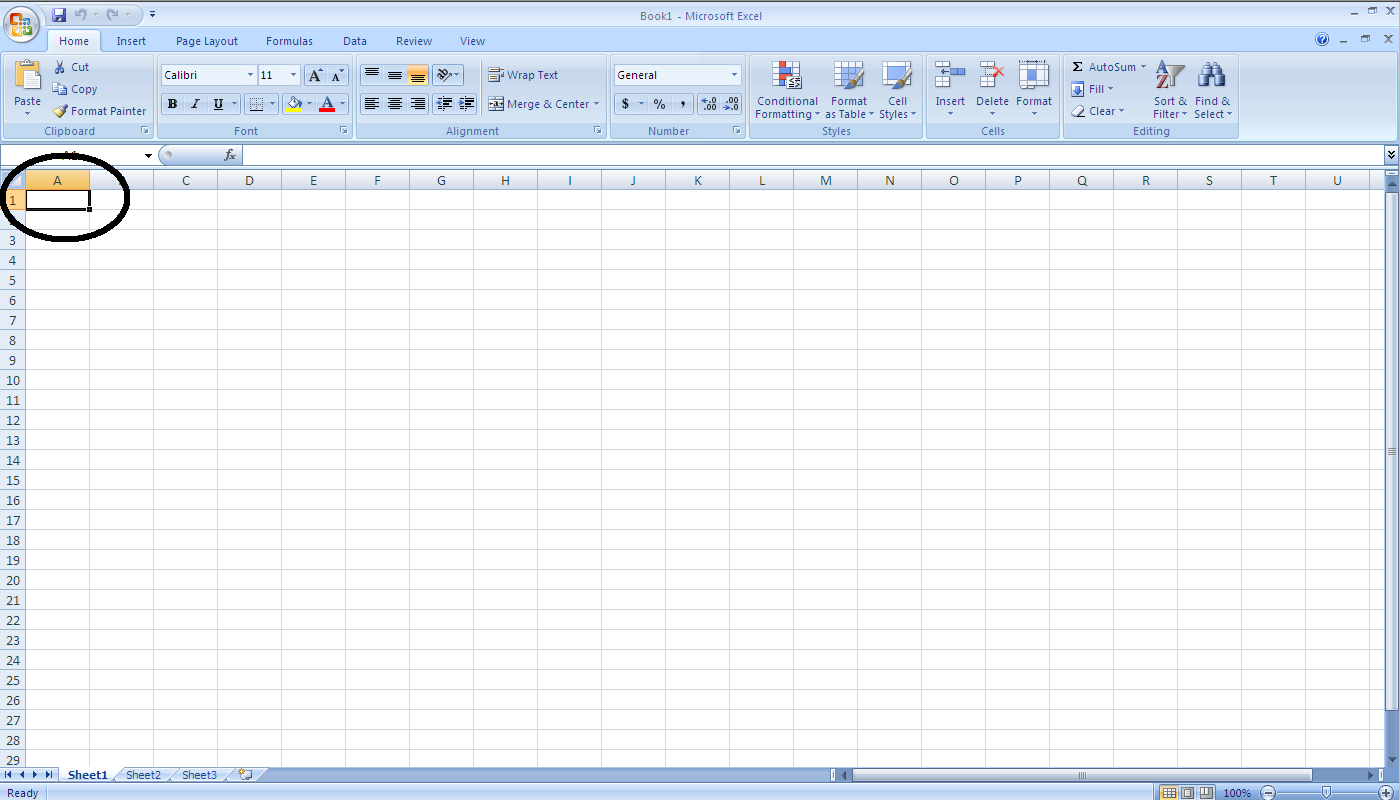
- Step 2: click in a cell, such as A1.
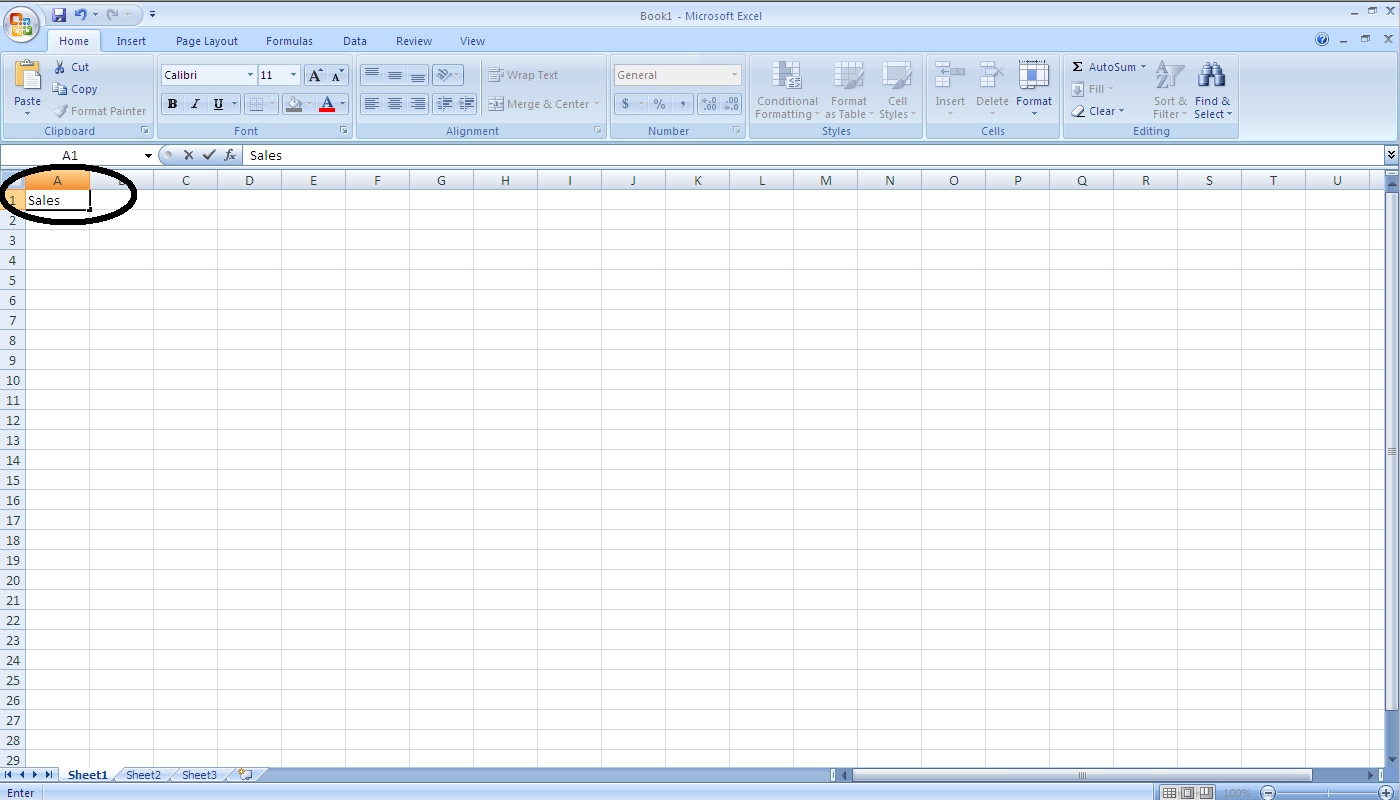
- Step 3: use the keyboard to add a number or text to the cell (e.g. Sales). To complete the entry, press the 'Enter' key or use the mouse to click on another cell.
AutoFill a field(s)
- A few Notes about the AutoFill feature:
- Can be used with both numbers and text
- Can be applied to both rows and columns
- The start of a sequence (numbers or text) must be given (either in a row or column). As few as two cells with numbers or text can be used.
- The use of text sequences must correspond to those defined in Excel (e.g. list of months), or a custom text sequence can be specified.
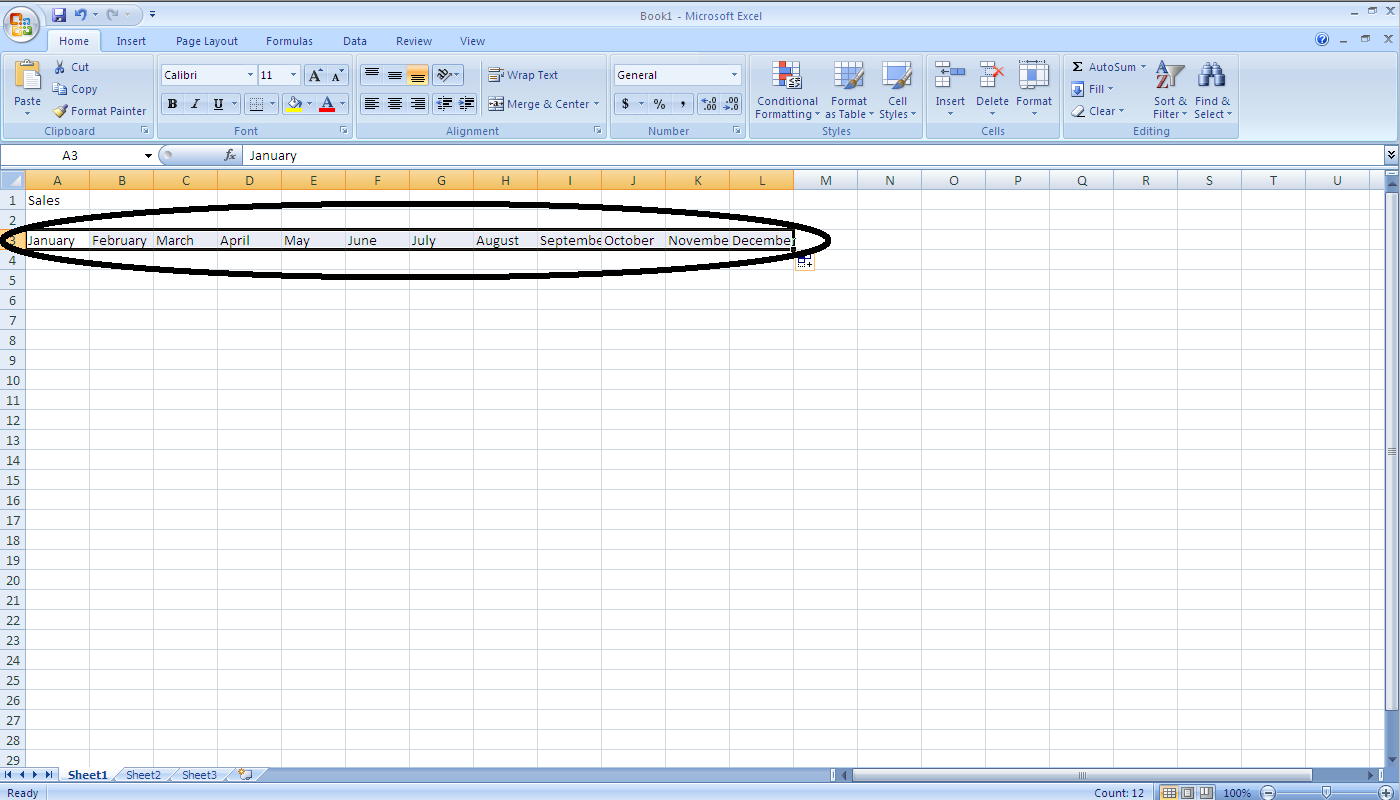
- Example of using Autofill to complete the list of months in a row.
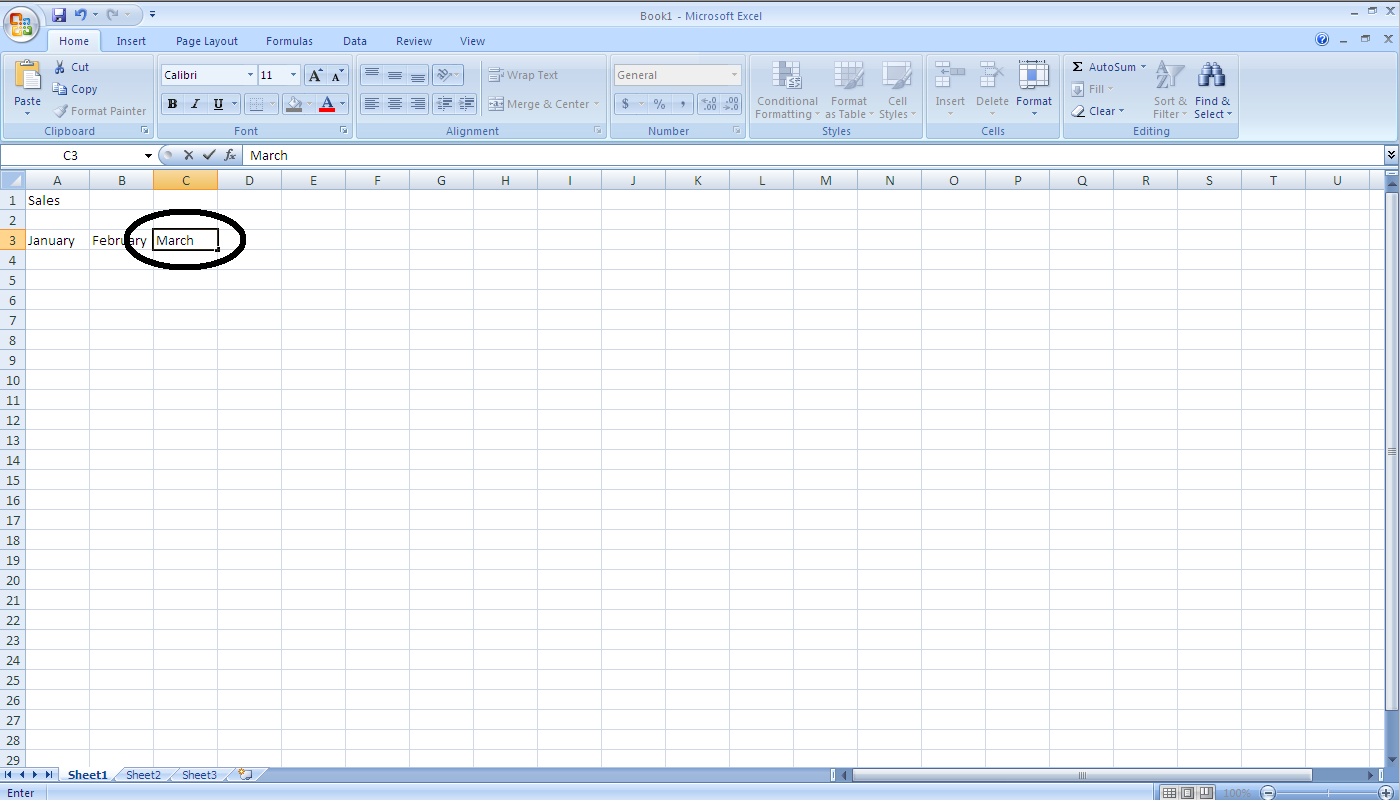
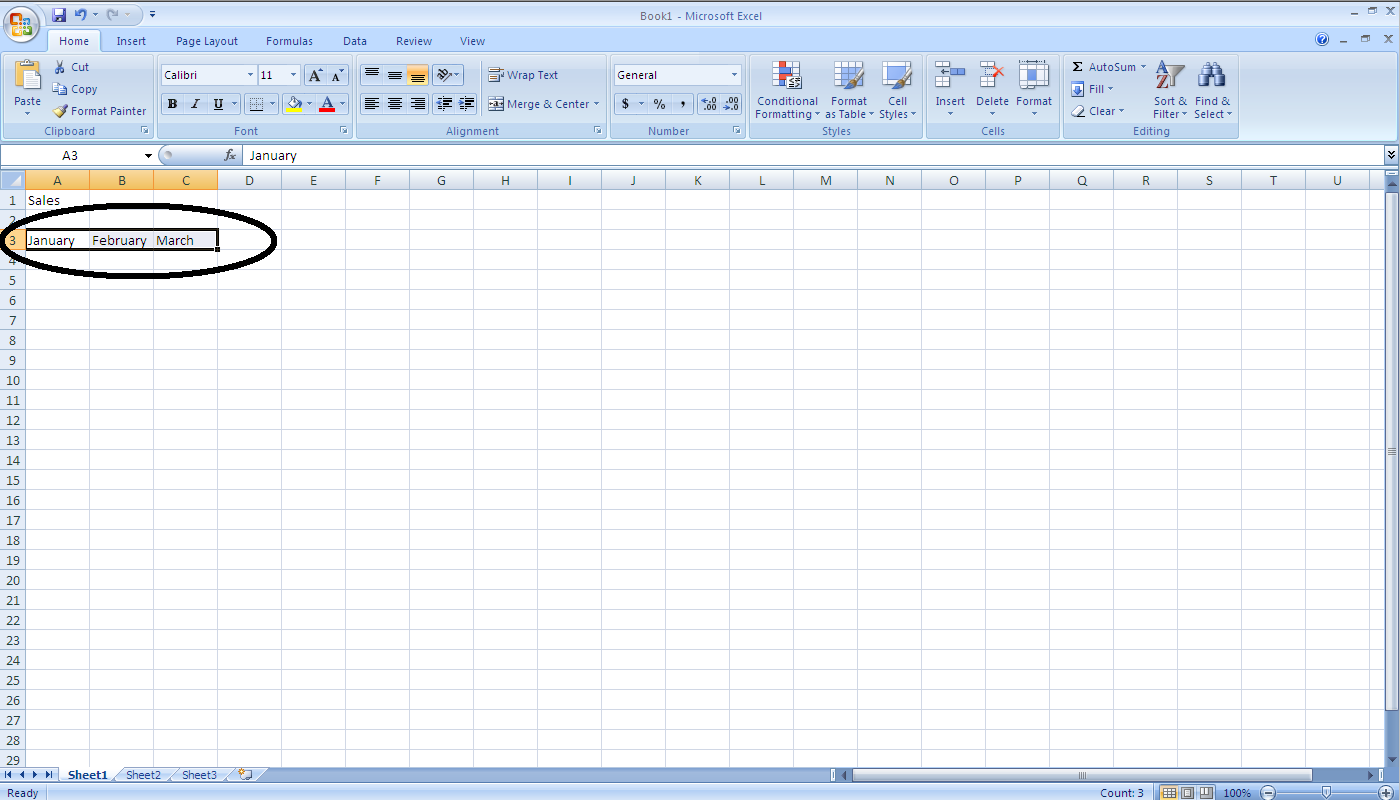
- Step 1: in cell A3 enter 'January', in cell B3 enter 'February', and in cell C3 enter 'March'.
- Step 2:highlight cells A3 to C3, by clicking-and-dragging overs cells A3 to C3. A rectangular box will be shown to identify the selected cells.
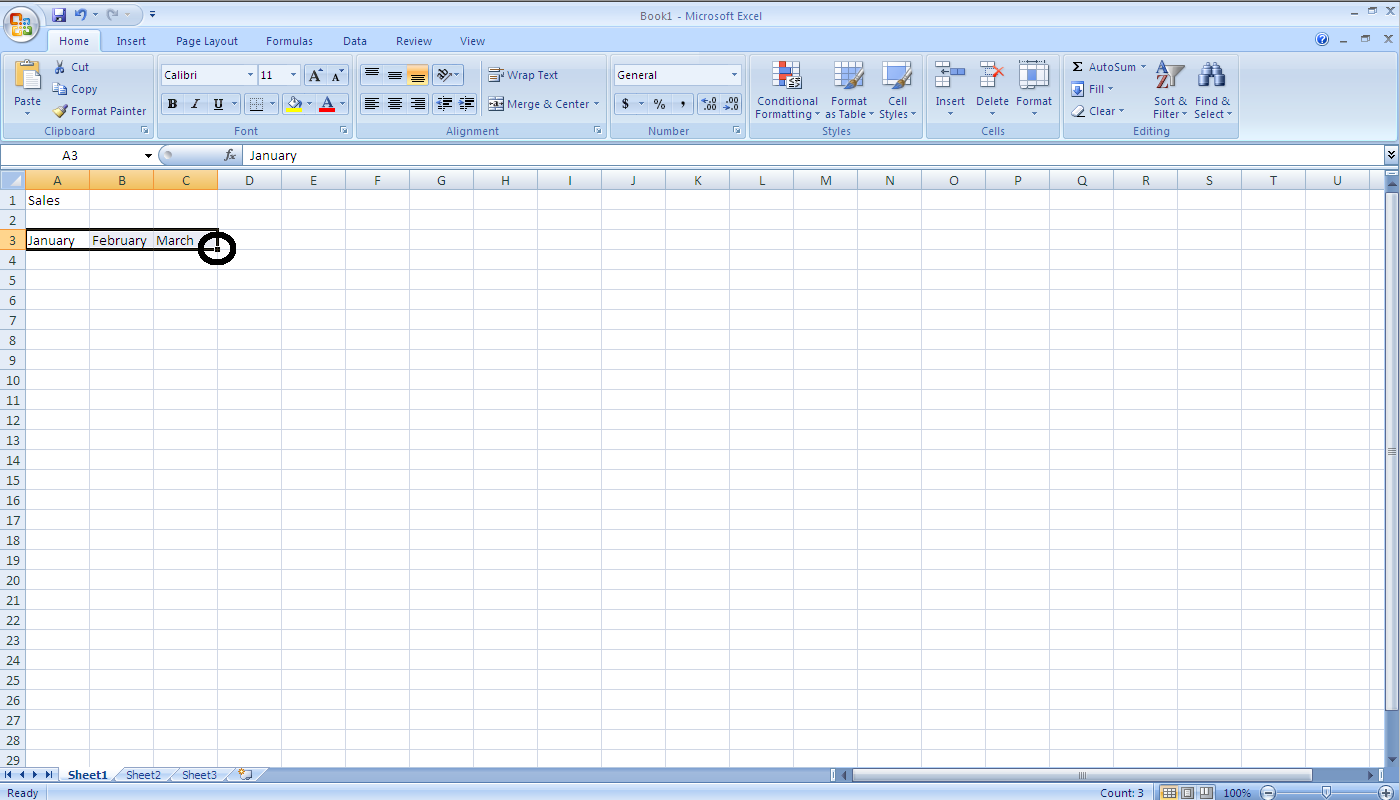
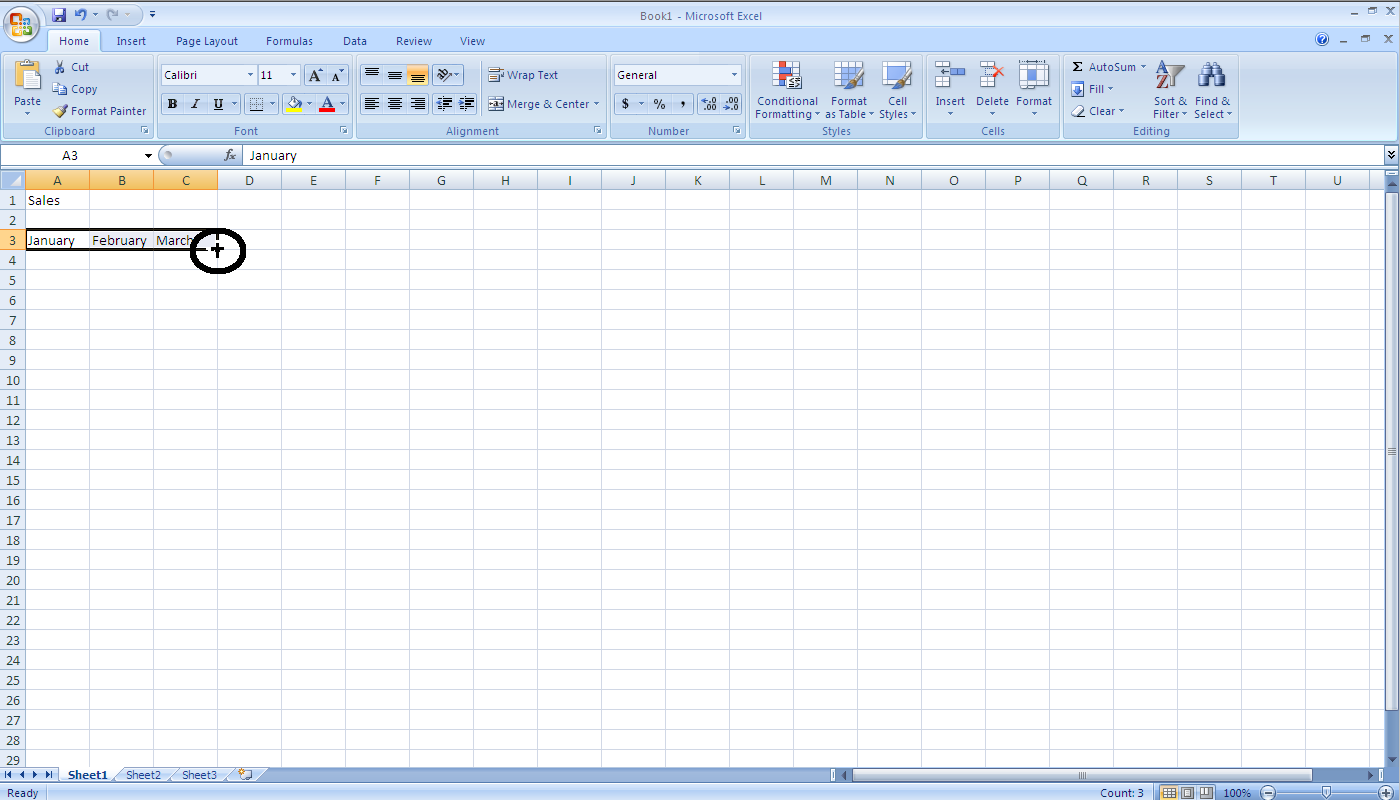
- Step 3:Place the cursor on the Fill Handle (located on the lower right corner of the last highlighted cell). The cursor should turn to a black cross.
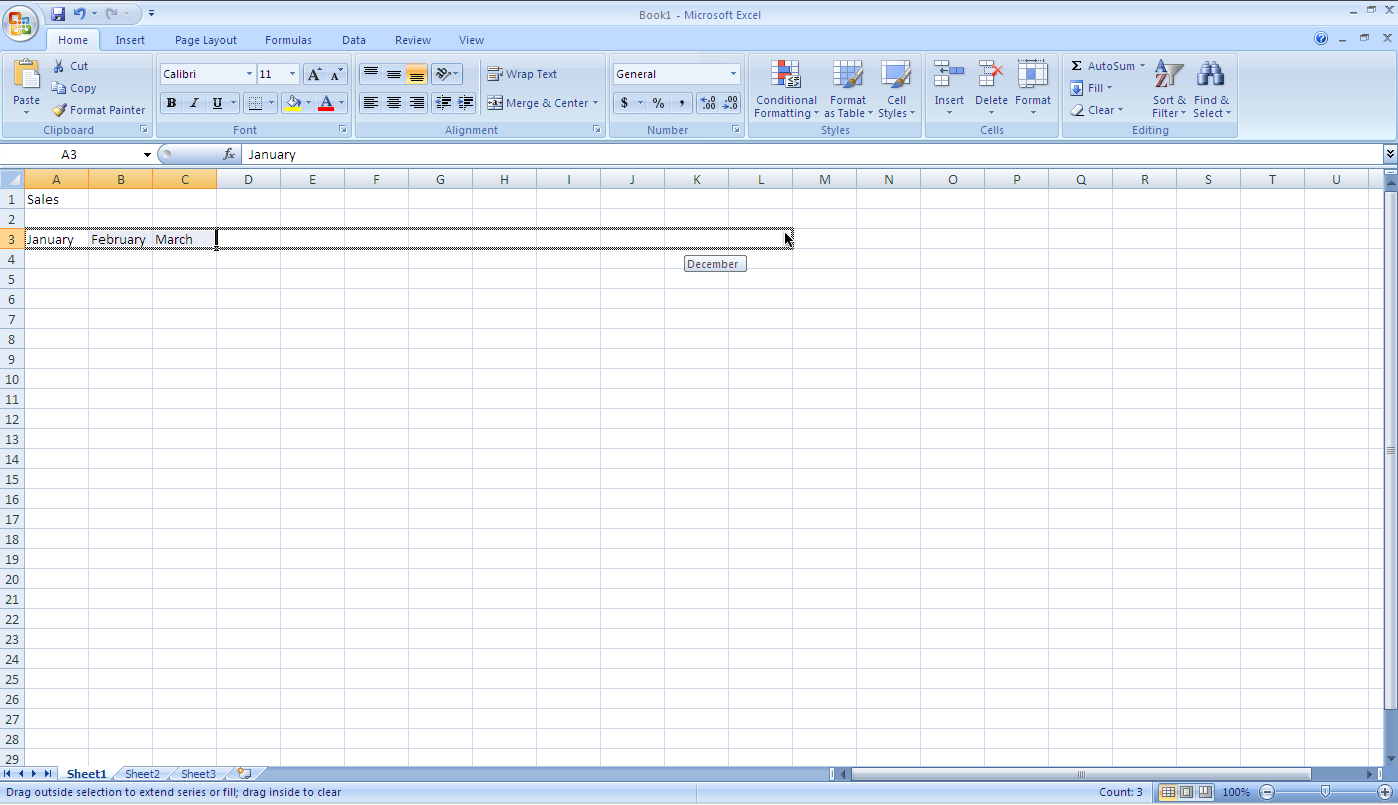
- Step 4: drag the cursor to L3.
- Step 5: Release the cursor. The remaining months should be automatically entered.
- Exercise: use AutoFill to complete a sequence of numbers (10, 20, 30, 40, and 50) in a column.
Set-up appropriate field formats (currency, numbers, text, etc.)
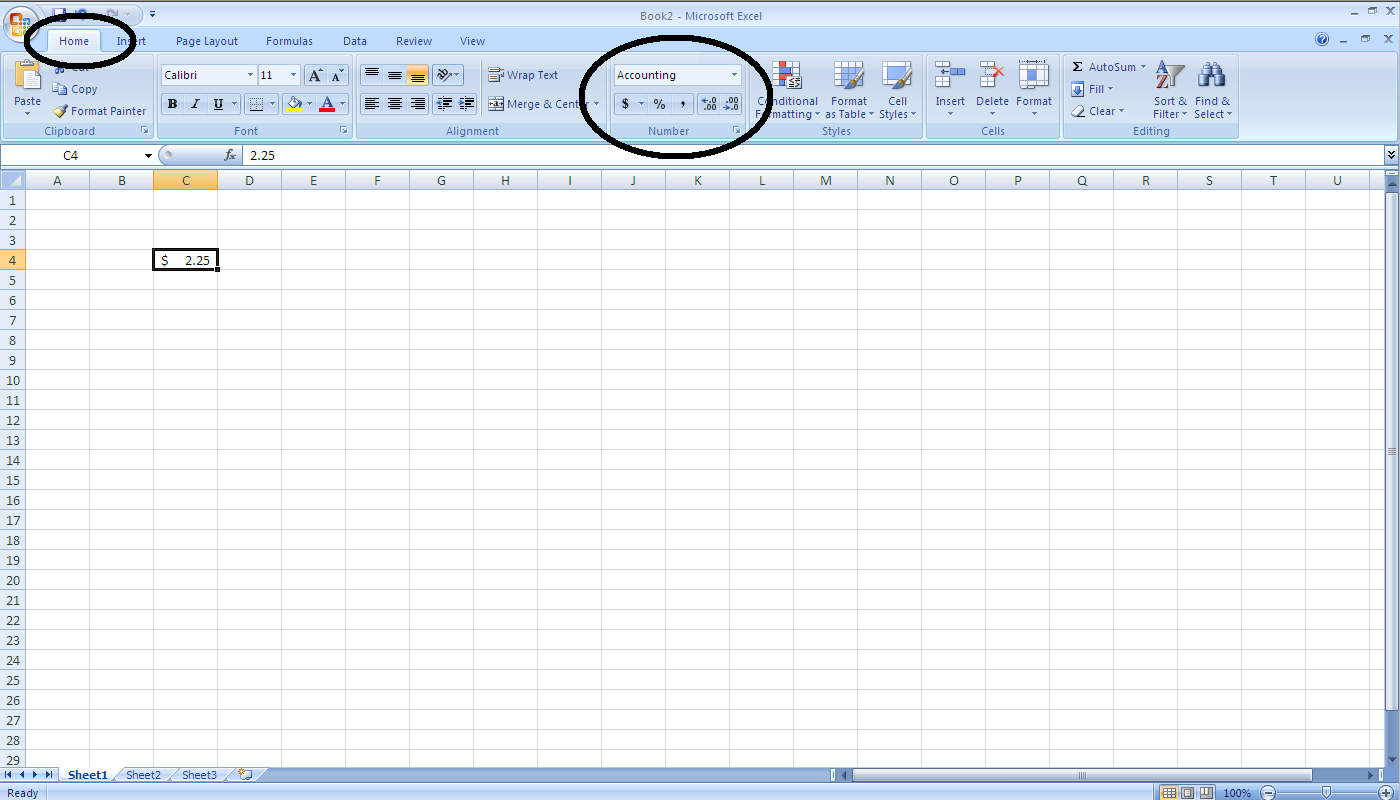
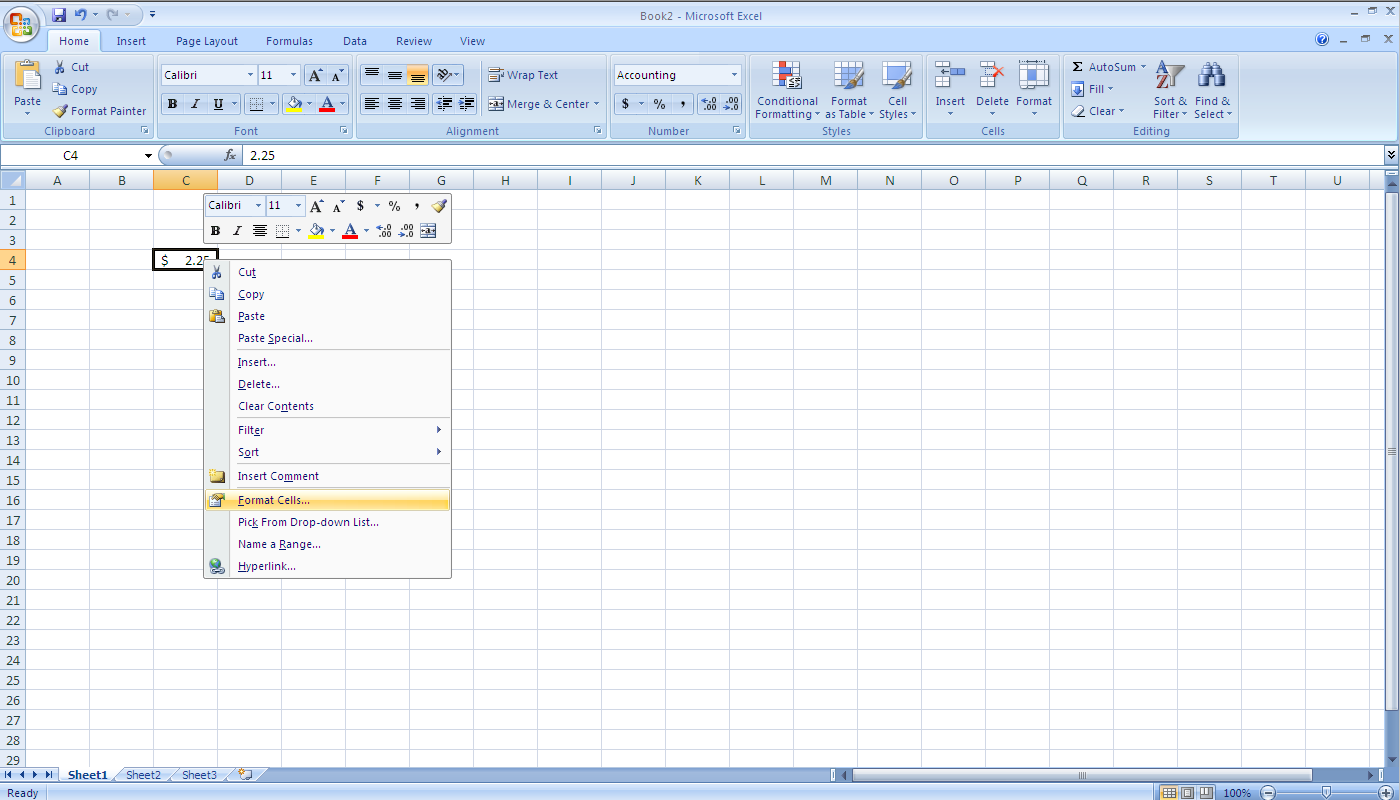
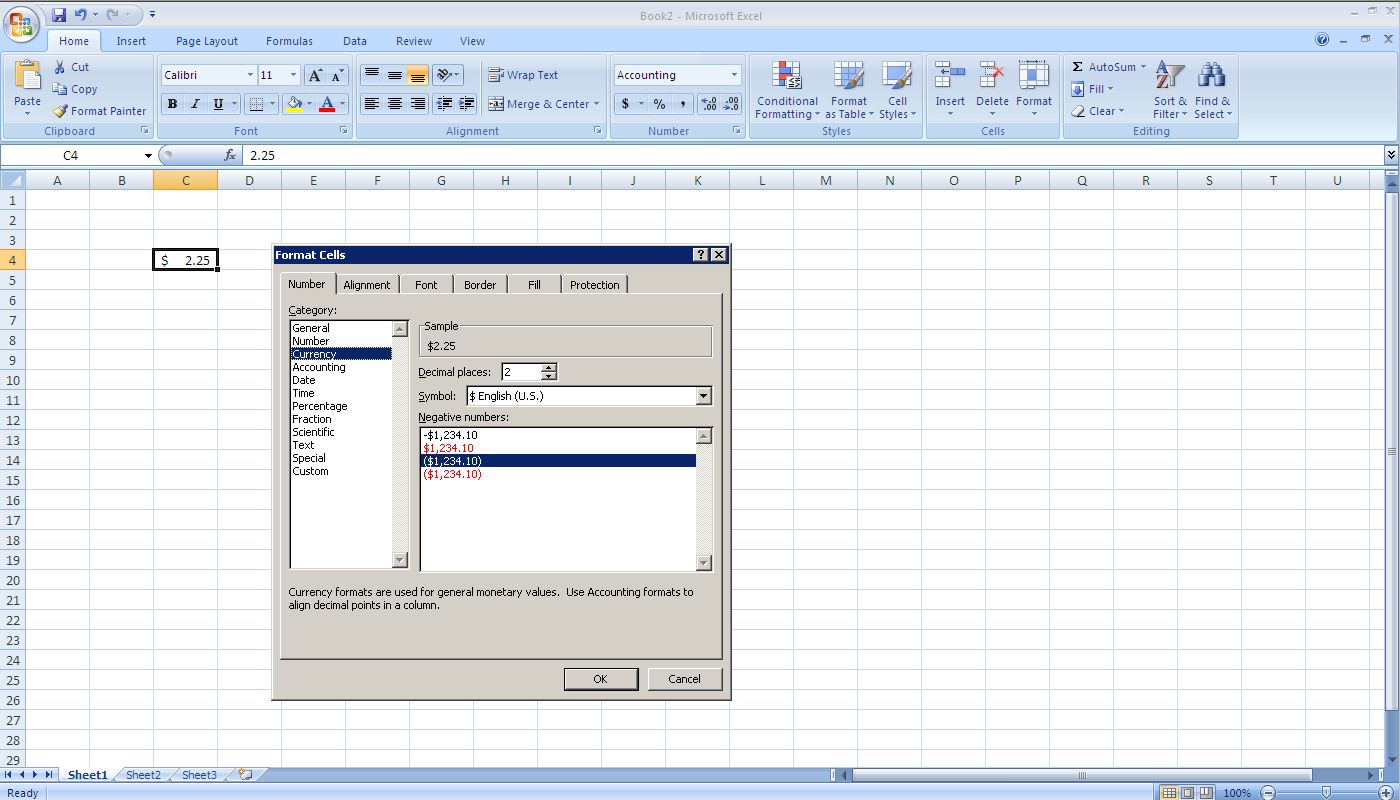
Formatting provides a mechanism to make the data in a spreadsheet more readable. Both text and numbers can be formatted. When a cell with the data you wish to format is selected, use either the ribbon (‘Number’ contextual menu as part of ‘Home’ in the main toolbar) or right-click using your mouse and select ‘Format Cells’ from the drop-down menu to open a new panel (select the ‘Number’ tab in the new panel).
- screenshot of ribbon
- screenshot of drop-down menu
- screenshot of formatting panel
Calculate basic statistics
- The material below is from: http://phoenix.phys.clemson.edu/tutorials/excel/stats.html
- The following covers the commands to performing basic statistics in Microsoft Excel 2007 (for Windows). A step-by-step guide will be added.
- The following basic statistics will be covered:
- Count
- Min
- Max
- Average
- Median
- Mode
- Standard Deviation
- Show an example for one stat, and then indicate that it will be the same pattern for the different function keywords.
- Notes about specifying functions:
- Functions can be specified directly in cells (including the range of cells to be included in the calculation), or in the Function Toolbar.
- Always use alternative calculations to check for errors when using functions.
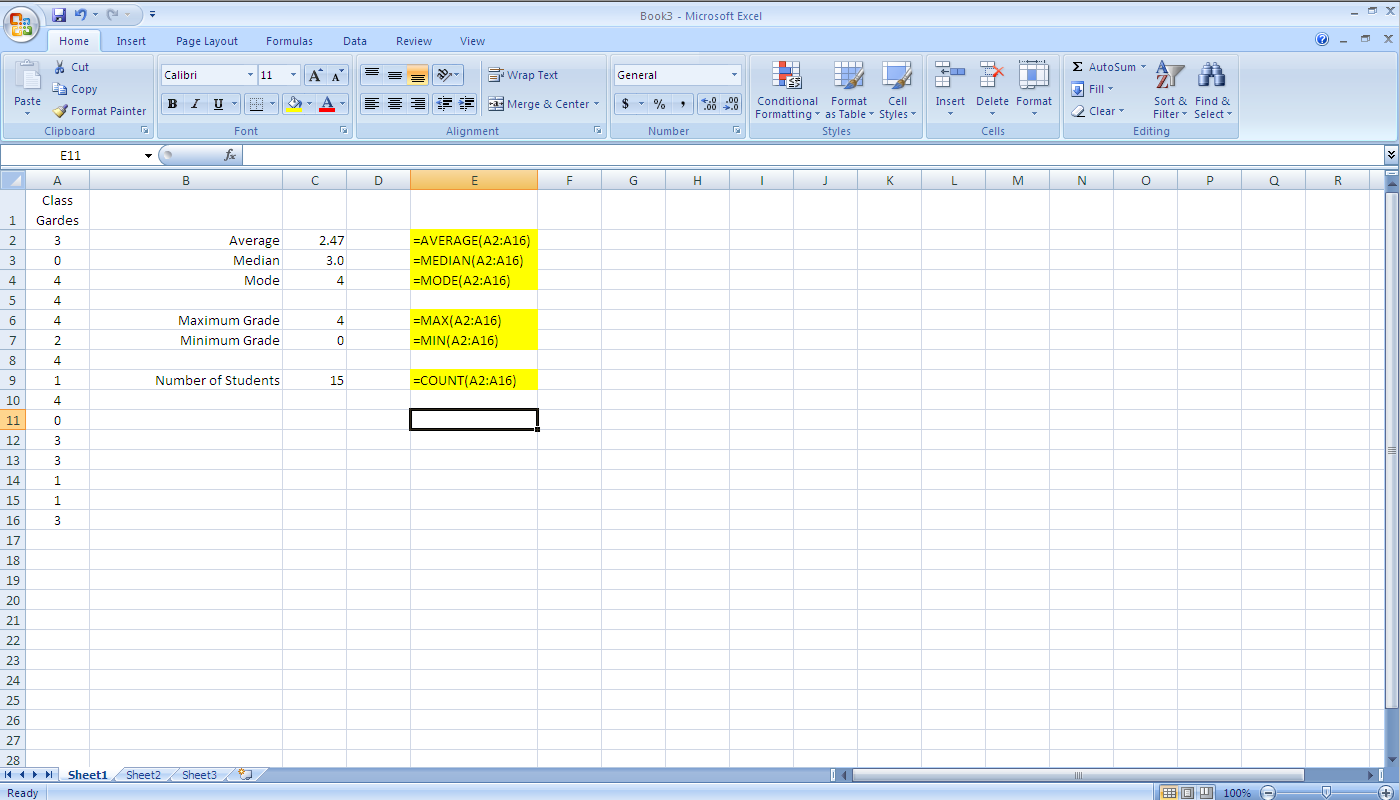
- The COUNT( ) function gives the number of cells that contain numbers. Its syntax is =COUNT(value1, value2, ...).
- The MIN( ) function returns the smallest value in a set of numbers. Its syntax is =MIN(number1, number2, ...).
- The MAX( ) function returns the largest value in a set of numbers. Its syntax is =MAX(number1, number2, ...).
- The AVERAGE() function return the average, or arithmetic mean. Its syntax is =AVERAGE(number1, number2, ...).
- The MEDIAN() function returns the middle number in a set of numbers. Its syntax is =MEDIAN(number1, number2, ...).
- The MODE() function returns the most frequently occurring value of a set of numbers. Its syntax is =MODE(number1, number2, ...).
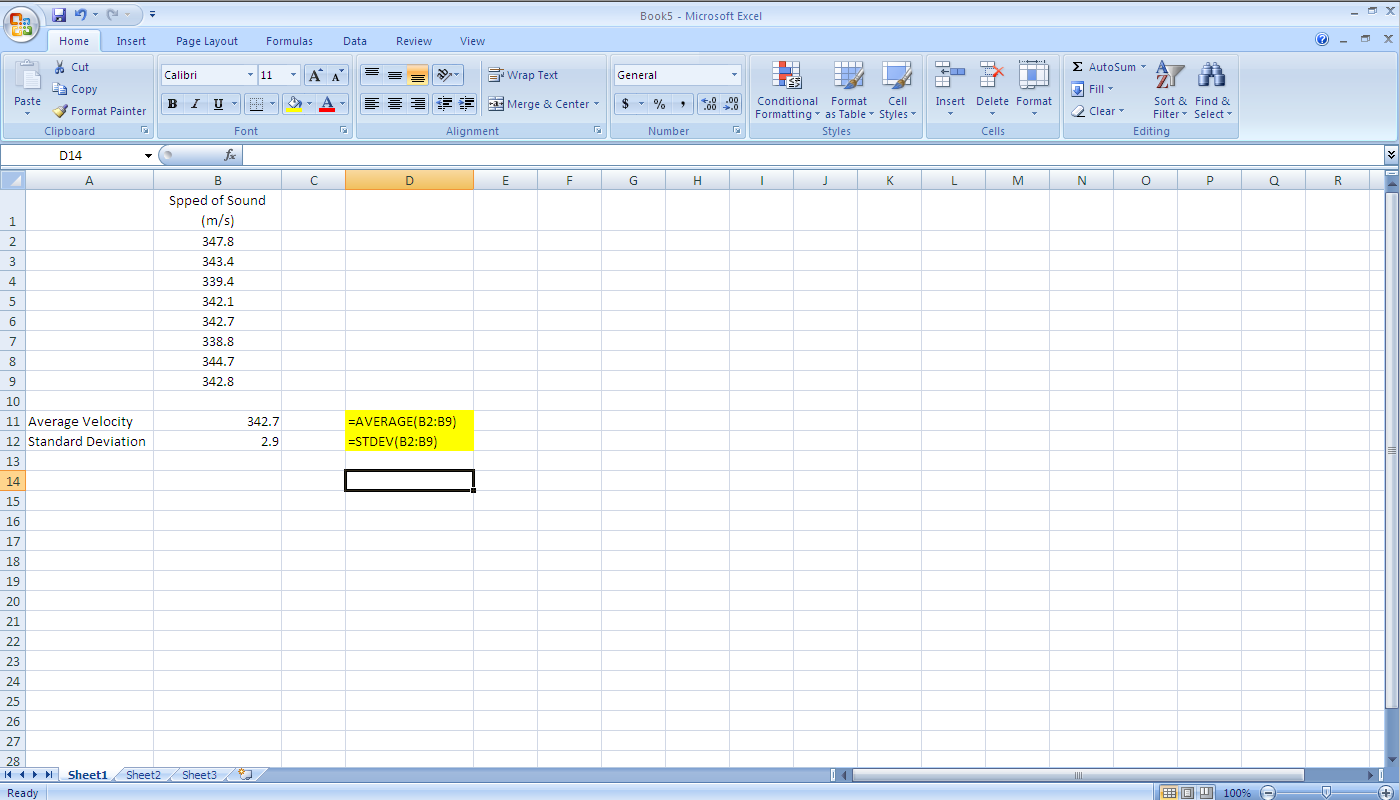
- The STDEV( ) function returns the standard deviation to measure of the dispersion of a set of values. Its syntax is =STDEV(number1, number2, ...).
