Navneet: Week 1 - Lab 1
From wiki.ucalgary.ca
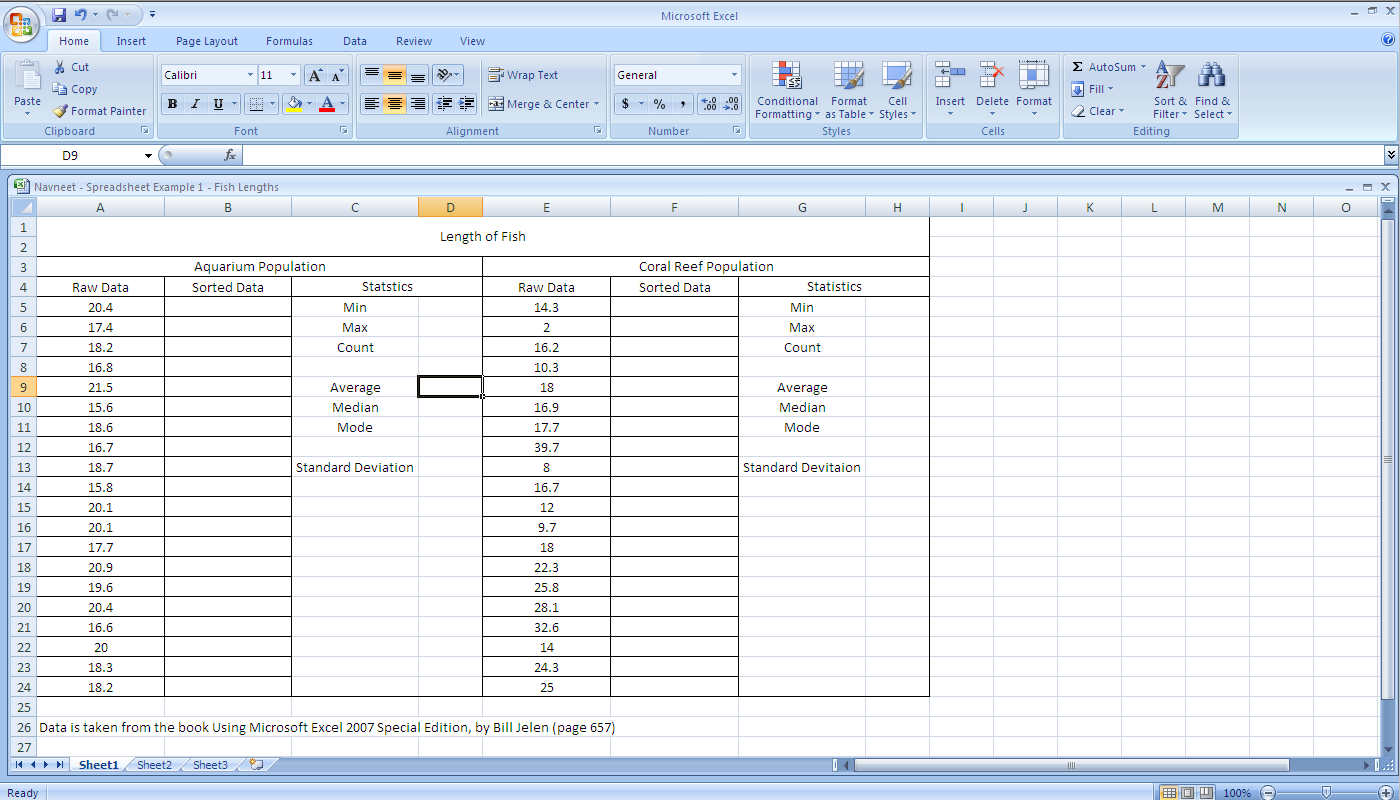
EXAMPLE. The spreadsheet below contains fish length data for two populations, Aquarium and Coral Reef. Download the spreadsheet and complete the following tasks, as well as answer the following questions:
- Tasks:
- Sort the data of the two populations in ascending order
- Calculate the min, max, count, average, median, mode, and standard deviation of each population
- Questions:
- What is the relation between the averages of the two populations?
- What is the standard deviation of each population?
- What is the range (min and max) and median of each population, and what is the relation of these values to the standard deviation of the their respective population?
- What is the mode of each population?
- How does Excel handle the case when there is more than one solution (hint: look at the ascending order of the data)?
- Create an example data set with no repeating numbers. When calculating the mode in this scenario what does Excel return?
