Courses/Computer Science/CPSC 203/CPSC 203 Template/Labs Template/Week 3 - Lab 2: Query Analysis Examples (including some textual analysis). Review for Assignment 2
Notes
- Skills covered in this module:
- Create Query Analysis
- A step by step extremely difficult hard to follow example of how to properly perform some query analysis on data including some textual analysis.
- Currently, sample screenshots are provided. Once a copy of Office 2007 is obtained, sample databases will be made, along with their corresponding screenshots.
Query Analysis
Basic Notion: The output of one query, is the input for the next query. An analysis is composed of a sequential set of queries (i.e. a “path” in our dots-and-edges language).
Working from the data on the “Who are We” Survey, you will rank websites from Most-To-Least Commonly Preferred. Using the spreadsheet data for "Who are We" survey, you will import the data into Access for further analysis.
Got to the "External Data" tab and then select from the Import section Excel.


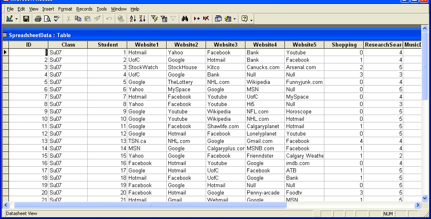
Then using the wizard select the spreadsheet file and import into a new table
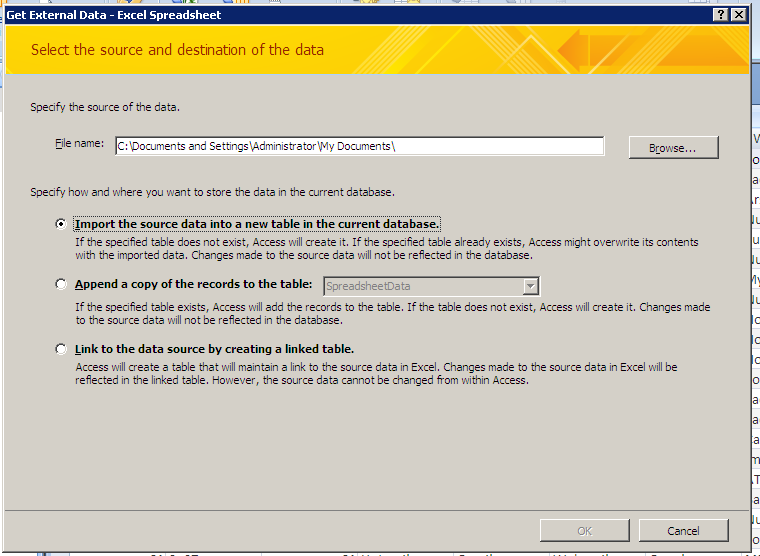

The result of that table should look similar to the following image.

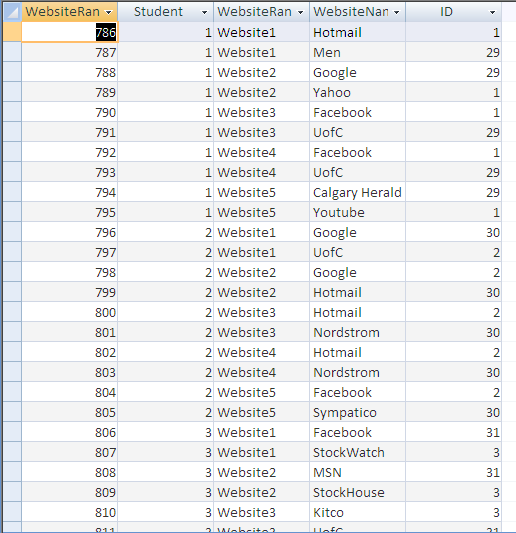
Extract the website data from the “Who Are We” spreadsheet, and put into “long” form:
WebsiteRank WebsiteName
1 FaceBook
2 Hotmail
3 …..
… 1 Facebook 2 MSN 3 ….
Now create a table to reconstruct the data to appear in the this type of structure which you will use for as the basis of future analysis.
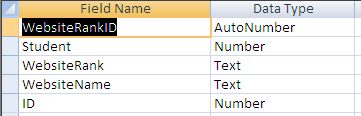

You will now have to populate the table, import the appropriate information from the Spreadsheet table into the correct columns.

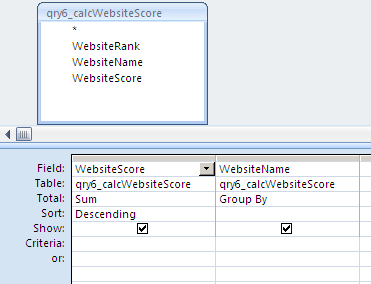
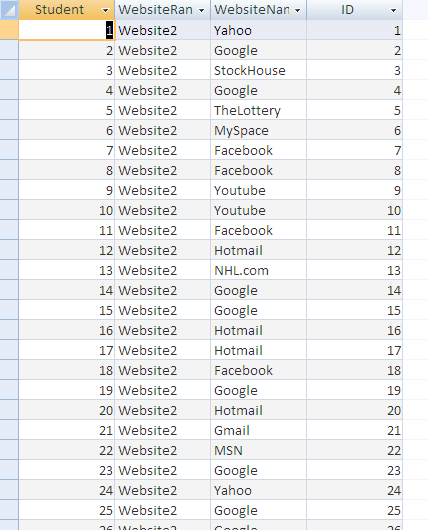
Create a query that will organize the information as follows as this will be the basis for further analysis.
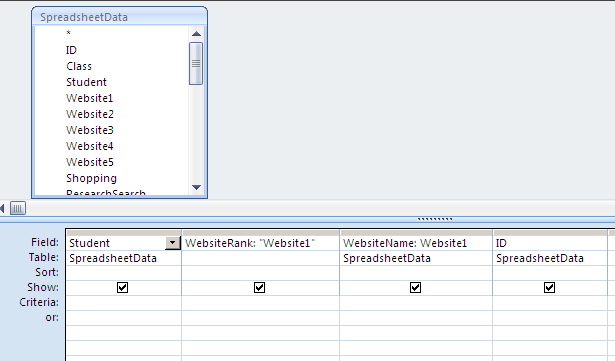

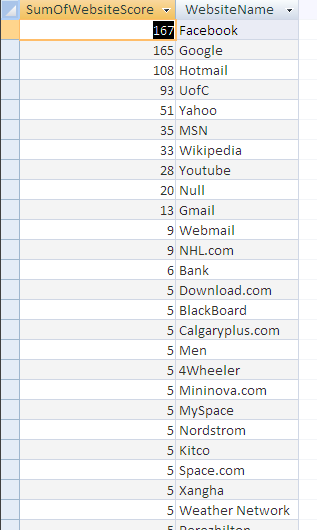
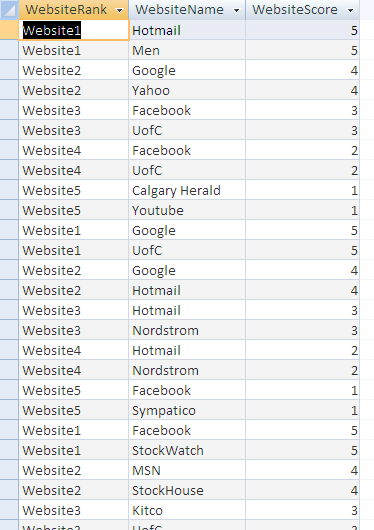
The results of this query should look similar to the one below.

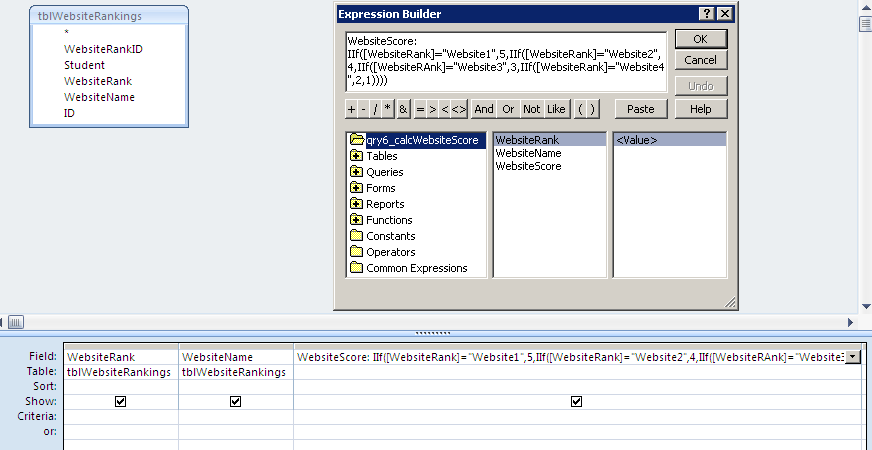
You will create a query that will calculate the website ranking use a custom formula like this one: IIf([WebsiteRank]="Website1",5,IIf([WebsiteRank]="Website2",4,IIf([WebsiteRAnk]="Website3",3,IIf([WebsiteRank]="Website4",2,1))))


Create another query based off this previous query that will do a summation of all the scores for each website.