Courses/Computer Science/CPSC 203/CPSC 203 Template/Labs Template/Week 1 - Lab 1: Introduction to Spreadsheets and Basic Calculations
From wiki.ucalgary.ca
< Courses | Computer Science | CPSC 203 | CPSC 203 Template | Labs Template
Contents
Notes
- Skills covered in this module:
- Type in some basic data
- AutoFill a field(s)
- Set-up appropriate field formats (currency, numbers, text, etc.)
- Calculate basic statistics
- A step-by-step guide is provided for the above listed skills.
- Currently, sample screenshots are provided. Once a copy of Office 2007 is obtained, sample spreadsheets will be made, along with their corresponding screenshots.
BOPPS
- Bridge
- This module is important, because it covers the foundation material to the spreadsheet component to the course.
- This module bridges to a students background knowledge, as well as the initial set of lectures on spreadsheets.
- First lets begin with what this class already knows using spreadsheets (TA quiries class).
- Objective
- In this module the student will learn: to type in some basic data, to use the AutoFill feature to automate sequence entry, to set-up appropriate field formats, and to calculate basic statistics.
- Pre-test
- (see above)
- Participation
- Ask students to use the provided set of data, based on data similar to Time-boxed Assignment 1 on Spreadsheets, to get students familiar with typing in some basic data. Data to be added.
- Ask students to use the sample spreadsheet (to be provided) to ask to students use the AutoFill feature. Sample spreadsheet to be added.
- Ask students to use the sample spreadsheet (to be provided) to ask to students use the AutoFill feature. Sample spreadsheet to be added.
- Post-test
- Go around to students computers one-on-one to see if they were able to complete the first spreadsheet correctly.
- Ask students to display their sample spreadsheet to see if they were able to use the AutoFill feature correctly.
- Ask students to display their sample spreadsheet to see if they were able to use the functions correctly to perform basic statistics
- Summary
- After completing this module, a student should be able to demonstrate the following skills:
- type in some basic data
- use the AutoFill feature
- use functions to perform basic statistics (template spreadsheet)
- After completing this module, a student should be able to demonstrate the following skills:
Background Material Resources
- 1 or 2 good background materials
- 1 or 2 template spreadsheets to work from (data and instructions page; data with a social context will be more interesting to students)
- General Introduction, Performing Basic Calculations, Advanced Calculations, Formatting Worksheets, Making Data Visible, and Manipulating Data in Excel 2007:
- Tutorial on basic calculations:
Type in some basic data
- The material below is from: http://inpics.net/excel07.html
- The following is a step-by-step guide to entering basic data into a spreadsheet in Microsoft Excel 2007 (for Windows).
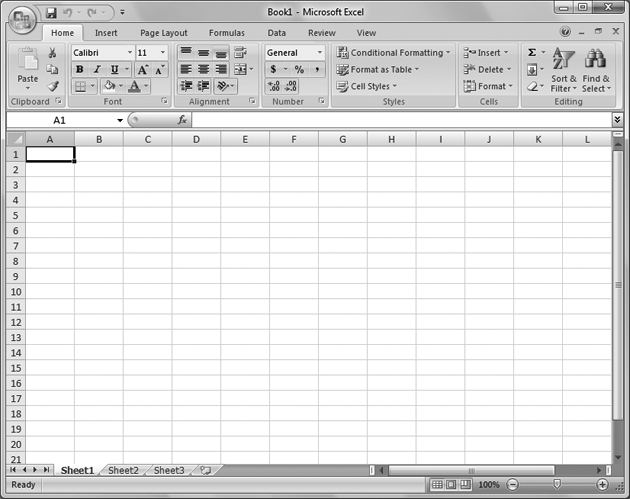
- Step 1: start Excel.
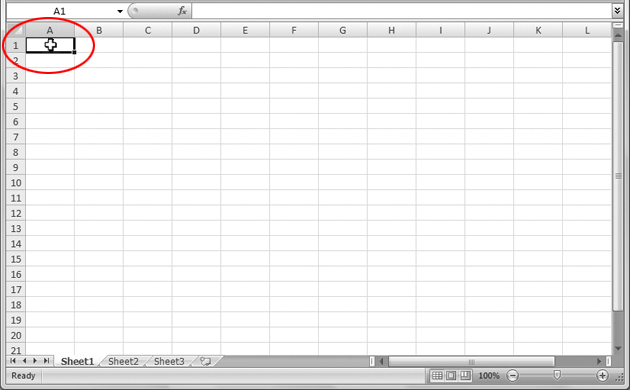
- Step 2: click in a cell, such as A1.
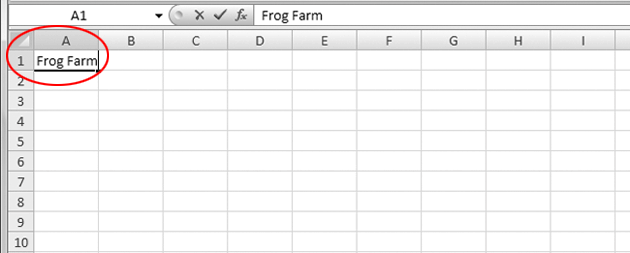
- Step 3: use the keyboard to add a number or text to the cell (e.g. Frog Farm). To complete the entry, press the 'Enter' key or use the mouse to click on another cell.
AutoFill a field(s)
- The following is a step-by-step guide to using the autofill feature in Microsoft Excel 2007 (for Windows).
- Notes about the Autofill feature:
- Can be used with both numbers and text
- Can be applied to both rows and columns
- The start of a sequence (numbers or text) must be given (either in a row or column). As few as two cells with numbers or text can be used.
- The use of text sequences must correspond to those defined in Excel, (e.g. list of months).
- Advanced: custom text sequences can be defined. Material will be added to demonstrate this feature.
- Example of using Autofill to complete the list of months in a row.
- Step 1: in cell A3 enter 'January', in cell BR enter 'February', and in cell C3 enter 'March'.
- Step 2:highlight cells A3 to C3, by clicking-and-dragging overs cells A3 to C3. A rectangular box will be shown to identify the selected cells.
- Step 3:Place the cursor on the Fill Handle (located on the lower right corner of the last highlighted cell). The cursor should turn to a black cross.
- Step 4: drag the cursor to L3.
- Step 5: Release the cursor. The remaining months should be automatically entered.
- Example of using Autofill to complete a sequence of numbers in a column.
- Material to be added.
- Example of specifying a custom text list in Excel.
- Material to be added.
Set-up appropriate field formats (currency, numbers, text, etc.)
- The following is a step-by-step guide to specifying the format to a field in Microsoft Excel 2007 (for Windows).
- Notes about the Format Cells feature:
- Demonstrate the use of Format Cells from the ribbon.
- Demonstrate the use of Format Cells by right-clicking on a cell, and selecting the Format Cells option from the drop-down menu.
- Example of using Format Cells, from the ribbon, to specify number formatting.
- Material to be added.
- Example of using Format Cells, by right-clicking, to specify currency formatting.
- Material to be added.
Calculate basic statistics
- The material below is from: http://phoenix.phys.clemson.edu/tutorials/excel/stats.html
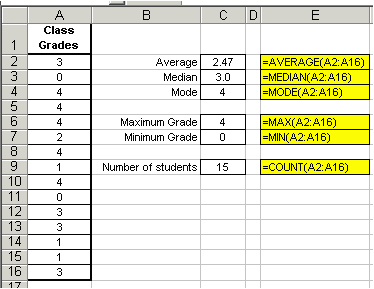
- The following covers the commands to performing basic statistics in Microsoft Excel 2007 (for Windows). A step-by-step guide will be added.
- The following basic statistics will be covered:
- Count
- Min
- Max
- Average
- Median
- Mode
- Standard Deviation
- Show an example for one stat, and then indicate that it will be the same pattern for the different function keywords.
- Notes about specifying functions:
- Functions can be specified directly in cells (including the range of cells to be included in the calculation), or in the Function Toolbar.
- Always use alternative calculations to check for errors when using functions.
- The COUNT( ) function gives the number of cells that contain numbers. Its syntax is =COUNT(value1, value2, ...).
- The MIN( ) function returns the smallest value in a set of numbers. Its syntax is =MIN(number1, number2, ...).
- The MAX( ) function returns the largest value in a set of numbers. Its syntax is =MAX(number1, number2, ...).
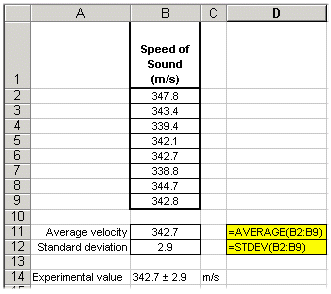
- The AVERAGE() function return the average, or arithmetic mean. Its syntax is =AVERAGE(number1, number2, ...).
- The MEDIAN() function returns the middle number in a set of numbers. Its syntax is =MEDIAN(number1, number2, ...).
- The MODE() function returns the most frequently occurring value of a set of numbers. Its syntax is =MODE(number1, number2, ...).
- The STDEV( ) function returns the standard deviation to measure of the dispersion of a set of values. Its syntax is =STDEV(number1, number2, ...).
