Maha Shouman
Contents
Instructor Info
- Email: mshouman@ucalgary.ca
Winter 2009
JYTHON TEST
Assignment 2
Databases Week 1 Lab 2
- Create a simple database for a Video Rental Store.
- The database has 1 table called Customers
- The Customers table has the fields CustomerID, FName, LName, DOB (date of birth), Telephone, Address, MembershipType. Make sure you give each field the proper type.
- Create a form for the table.
- Fill the Customers table with 5 records (using the form), the MembershipType field can be either Yearly or Monthly.
- Create a query showing the LName, FName, Telephone and membership type of all customers
- Create a report (based on the query created above) showing each customers LName, Telephone and MembershipType. Group the customers by MembershipType.
Databases Review
1. Create a new database.
2. Create a table called Orders with the fields: OrderID, ProductID, SalespersonName, SalesDate, Quantity and SellingPricePerPiece. Make sure the fields have the correct types and a primary key.
3. Create a table called Products with the fields ProductID, PName, PurchaseDate, Supplier and PurchasePricePerPiece. (hint: is a relationship required anywhere?)
4. Set the default quantity in the Orders table to 0.
5. Add the following records to the products table:
ProductID: 10089 , PName: Bath Salts, PurchaseDate: 10/20/2008, Supplier: Bath and Beyond, PurchusePricePerPiece: $2
ProductID: 10768 , PName: Shower Gel, PurchaseDate: 10/1/2008, Supplier: Lush, PurchusePricePerPiece: $4.50
6. Create a form for the Orders table. Using the FORM, add the following records:
OrderID: 1, ProductID: 10768, SalespersonName: Josh S., SalesDate: 10/21/2008, Quantity: 50, SellingPricePerPiece: $3
OrderID: 2, ProductID: 10089, SalespersonName: AJ Beans, SalesDate: 10/19/2008, Quantity: 15, SellingPricePerPiece: $3.25
OrderID: 3, ProductID: 10768, SalespersonName: AJ Beans, SalesDate: 10/18/2008, Quantity: 12, SellingPricePerPiece: $4.50
7. Create a query named query_1 that displays all the information in both tables.
8. Create a query named query_2 that displays all fields in both tables. However, limit the query to the Supplier "Lush".
9. Create an aggregate query (make sure the Totals button is selected) named query_3. Group the query using SalesPersonName and calculate the COUNT of orders for each salesperson.
10. Create a query named query_4. Show in it the fields OrderID, ProductID, Quantity, PurchasePricePerPiece and SellingPricePerPiece.
11. In query_4, create a new field called RevenueAmount. This should be calculated by Quantity*SellingPricePerPiece.
12. In query_4, create a new field called Status. This should display "Profit" is SellingPricePerPiece>PurchasePricePerPiece, "Breakeven" of they were equal and "Loss" otherwise.
13. Create a report of query_4.
14. Create a crosstab query from query_1. Let the rows show the SalesPersonName, the columns show the product name, and calculate the sum of Quantity.
Answers: Media: Database_Review_Answers.mdb
Programming
Design Skills
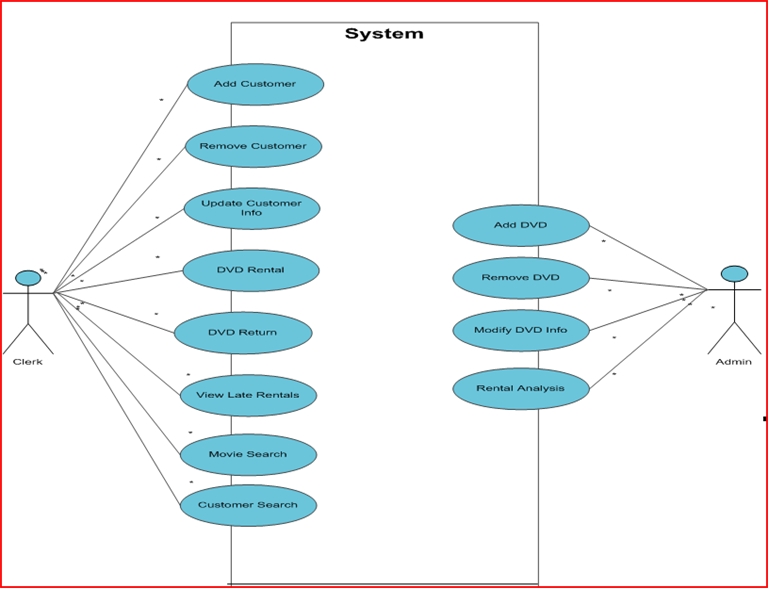
Media: UML_Use_Cases_updated.ppt
Assignment 1
- Due: Oct 27th 10 pm on Blackboard
- Read [this section on Spreadsheet design]
The information provided here serves more of a guideline than a rule. Remember that you will be graded on originality.
Introduction: State the purpose/goal of the survey and the information you are presenting. Give an overall summary of what you have done and what the survey is about.
Model: State an overview of the work you plan on doing. What statistics will you be using and why? How do you intend to divide the data? What charts will you create? Explain why you chose a specific chart type and what it is supposed to show. The key in this section is to be as detailed as possible.
Data: Try to re-organize the data in a better manner. Add statistics and summary statistics. Make sure they are useful and not there to fill up space. If/Lookup and pivot tables are useful. Make this data as presentable as possible. Try to show the data in a unique manner
Data Dictionary: Identify cell ranges in the data sheet. What type is the data? Is it raw or calculated? What information does it provide?
Dashboard: Create 3 charts representing the data. Make sure each one represents something of value. Also make sure you select the correct chart type. Also, a comparison between the different years of student should be made in at least one of the charts. Interpret each of your charts. What is the general trend? Basically summarize the information on the chart. Try to make your charts as original as possible
Spreadsheets
Media: Week1_lab2_exercises.xls
Media: Spreadsheet_Review_answers.xls
Databases
Week 2 Lab 1: Media: Week2_Lab1.mdb
Media: Week1_Lab2_Exercise.mdb
- Create the required relationship between the 2 tables.
- Design a multi-table query that shows "First Name", "Last Name", "Date of Birth", "Phone Number", "Address", "Average" and "School Name" for each student. Try to sort the result based on student's last name.
- Design a query to extract all top students (with average grater than %80) who study at University of Calgary and show their first name, last name and average.
- Design a query to show names of schools and the number of students in each of them.
- Design a query that shows school names and the number of students with an average between %80 and %90 in each of them.
Week 2 Lab 2:
Using the BookExamples database you already have, do the following:
- Create a multi-table query between Titles and Authors, showing the book's name, sales and advance. Also show the author's first and last names.
- Limit this query so that it only displays records with advance greater than 20000.
- Create a new column called Author_Value. It should display "Best Seller" if sales > 200000, and display "Average Seller" if sales were >10000. Otherwise "Dump" should be displayed.
- Save this query as LabQuery.\
- Create a crosstab query out of Lab query. Set the author's last name as the row attribute and title name as the column. Calculate the sum of the sales in the query.
